
Last updated October 11, 2026. Pricing, licenses, and features were checked against each vendor’s own pages on that date.
An AI agent can fail without throwing a single error. A support agent that calls the refund tool twice still returns a confident answer and a normal status code.
AI agent observability tools catch those silent failures by recording every step of an agent run as a trace, scoring the output with evals, and alerting a human when quality, cost, or latency drifts.
AgentStack is an independent publication that helps AI, operations, and product leaders choose agent tools, and this guide anchors our AgentOps coverage. No vendor paid for placement, per our editorial standards and disclosure policy. For how tracing fits with evals, gateways, and guardrails, see the full AgentOps tools map.
For most teams in October 2026, Langfuse is the safest default. Its core is MIT licensed, it accepts OpenTelemetry data, and its entry cloud plan costs $29 per month. LangSmith wins for LangGraph agents, Datadog wins when it already runs production monitoring, and Braintrust, HoneyHive, or Galileo win when evals gate releases.
TL;DR
- Langfuse is the best overall pick, with an MIT core, free self-hosting, and a $29 per month Core plan.
- LangSmith fits LangChain and LangGraph teams best at $39 per seat per month, and self-hosting it requires Enterprise.
- Datadog Agent Observability bills only LLM spans, with 40,000 free per month and Pro from $160 per month on annual billing.
- Braintrust, HoneyHive, and Galileo suit eval-gated releases, and Galileo adds inline guardrails as part of Cisco.
- At least five vendors changed owners between January and May 2026.
- All 12 tools document OpenTelemetry or OTLP ingestion, which keeps switching costs low.
Top Picks at a Glance: 12 Agent Observability Tools Compared
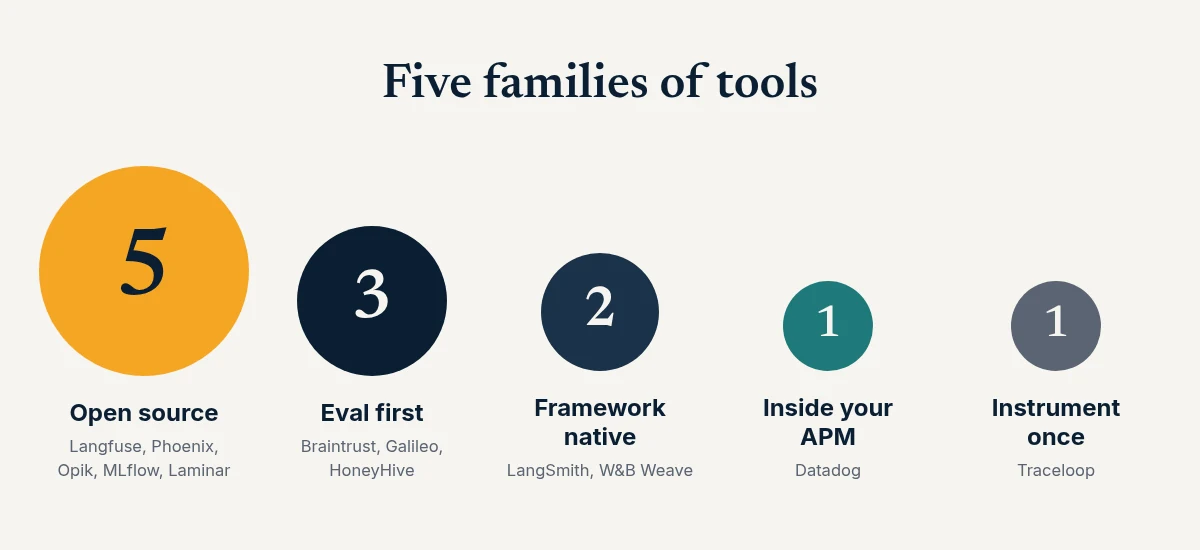
The 12 best AI agent observability tools in 2026 split into open-source platforms, framework-native tools, eval-first platforms, and APM extensions. The table below gives the one-line verdict, license, OpenTelemetry support, and entry price for each, so you can shortlist two or three before reading the full reviews.
| Tool | Best for | Open source? | OpenTelemetry | Paid plans start at | Standout |
|---|---|---|---|---|---|
| 1. Langfuse | Most teams, any framework | Yes, MIT core | Native ingestion | $29/mo (Core) | Free self-hosting at production scale |
| 2. LangSmith | LangChain and LangGraph agents | No (SDK is MIT) | OTLP endpoint | $39/seat/mo (Plus) | Engine clusters agent failures every 6 hours |
| 3. Arize Phoenix and AX | OpenTelemetry-first and RAG-heavy teams | Phoenix is source-available (Elastic 2.0) | Native, via OpenInference | $50/mo (AX Pro) | Free local tracing, managed AX upgrade |
| 4. Braintrust | Eval-gated releases | No | OTLP endpoint | $249/mo (Pro) | Alerts written as SQL on eval scores |
| 5. Datadog Agent Observability | Teams already on Datadog | No | Native GenAI conventions | $160/mo (Pro, annual) | Bills LLM spans only |
| 6. Galileo | Regulated enterprises needing guardrails | No | OTel and OpenInference | $100/mo per 1.2M spans, annual (Splunk) | Luna eval models run as guardrails |
| 7. Opik by Comet | Budget-conscious teams | Yes, Apache 2.0 | Native | $19/mo (Pro Cloud) | Full feature set in open source |
| 8. MLflow | Teams on MLflow or Databricks | Yes, Apache 2.0 | Fully compatible | Free; managed via Databricks | Agent traces beside the model registry |
| 9. W&B Weave | ML teams on Weights & Biases | SDK is Apache 2.0 | OTLP endpoint | $60/mo (CoreWeave Forge Pro) | Traces beside training runs |
| 10. Laminar | Browser and coding agents | Yes, Apache 2.0 | OTLP ingestion | $30/mo (Starter) | Browser session recording |
| 11. HoneyHive | Enterprise agent regression testing | No | OpenTelemetry-native SDK | Custom (Enterprise) | Self-hosted, hybrid, or single-tenant |
| 12. Traceloop (OpenLLMetry) | Vendor-neutral instrumentation | OpenLLMetry is Apache 2.0 | Built on OpenTelemetry | Custom (Enterprise) | Instrument once, export to 25+ backends |
For a head-to-head of the three most shortlisted tools, see Langfuse vs LangSmith vs Braintrust.
None of these tools blocks a risky tool call before it executes. That job needs a runtime guardrail such as Galileo’s or a gateway policy.
What Is AI Agent Observability, and How Is It Different From LLM Monitoring?
AI agent observability is the practice of recording every step an AI agent takes, including model calls, tool calls, retrieval, and handoffs, as a structured trace, then scoring those traces with evaluations and alerting on drift. LLM monitoring watches single model calls, while agent observability follows the whole multi-step run and the decisions inside it.
Traces, spans, and the OpenTelemetry standard
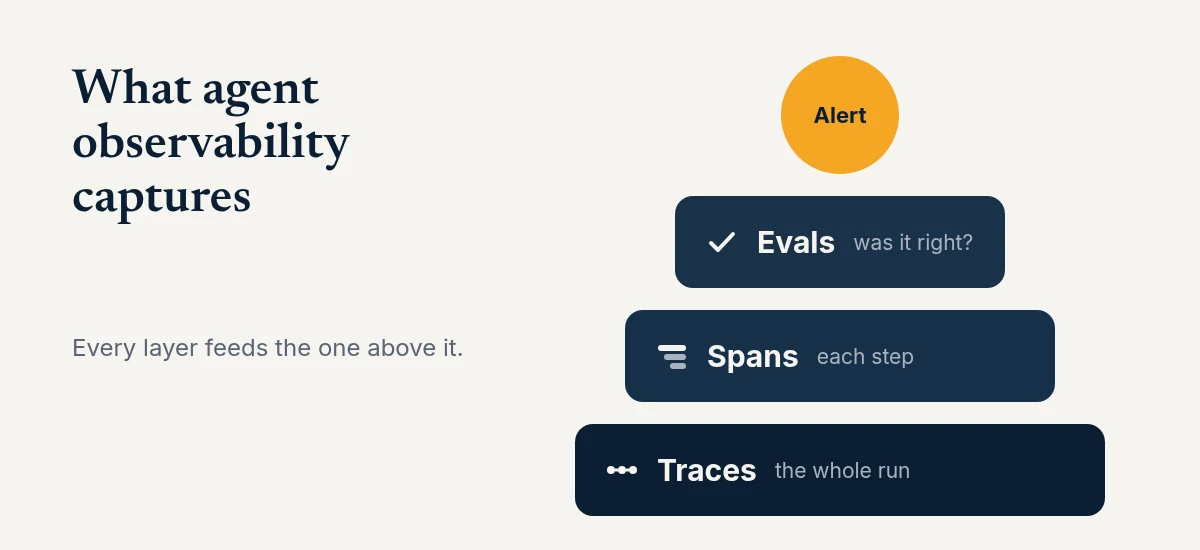
A trace is the full record of one agent run. A span is one timed step inside it, such as a model call or an API request.
OpenTelemetry, the open standard most of these tools build on, defines GenAI agent span types such as invoke_agent, plan, and execute_tool. Its agent span specification is still marked Development status as of October 2026. Pin the convention version your instrumentation uses, since attribute names can still change.
Which framework you build on decides how much tracing you get for free; our AI agent frameworks guide compares native OpenTelemetry support across 12 of them.
Key takeaway: a trace shows what the agent did, an eval shows whether it was right, and an alert tells someone in time to act. Missing layers mean glue code.
How We Chose and Evaluated These Tools
We started from more than 20 tools named in the top-ranking guides, Reddit threads, and vendor comparison pages for best AI agent observability tools and close variants. We scored each one against nine criteria using vendor documentation, pricing pages, GitHub repositories, and acquisition announcements, all reviewed on October 11, 2026.
Our nine criteria
- Tracing depth: nested agent traces, tool and retrieval spans, sessions, and graph views.
- OpenTelemetry and OpenInference support: standard OTLP ingestion versus a proprietary SDK.
- Evals integration: online and offline evals, LLM-as-judge and code scorers, and human review.
- Alerting and monitors: native thresholds on cost, latency, errors, or eval scores.
- Cost tracking: token and dollar cost per span, trace, and user.
- Self-hosting and license: whether you can run it yourself, and under which license.
- Framework integrations: coverage of LangGraph, OpenAI Agents SDK, CrewAI, Google ADK, and similar frameworks.
- Pricing model: seats, spans, units, gigabytes, or events, and how predictable the bill is.
- Enterprise readiness: SOC 2 Type II, SSO, RBAC, audit logs, and ownership stability.
The trace-to-alert loop
We gave the most weight to what we call the trace-to-alert loop. Can a team go from a raw trace to an automated eval to a routed alert inside one product, without scripts in between? Tools that close the loop natively ranked higher than tools that need a second system for alerting.
What we did not test
This edition is a documentation and pricing review, and we ran no load benchmarks of our own. A 60-run study by BenchClaw found that self-hosted Langfuse 4.10.0 and Arize Phoenix 20.1.0 each captured 400 of 400 spans across 20 runs per tool.
Treat capture completeness for the other 10 tools as unverified until you test it on your own agent.
Who Owns What: The 2026 Consolidation Every Buyer Should Check
At least five agent observability vendors changed owners between January and May 2026, and one of them stopped shipping new features. Roadmaps follow the parent company, so check who owns a tool, what its license guarantees, and how you export traces before you sign a multi-year contract.
| Product | New owner | Date | What changed, per the announcements |
|---|---|---|---|
| Langfuse | ClickHouse | January 16, 2026 | MIT license unchanged; Langfuse Cloud and self-hosting continue |
| Helicone | Mintlify | March 3, 2026 | Maintenance mode: security fixes, bug fixes, and new models, with no new features |
| Traceloop | ServiceNow | March 2026 | Platform becomes part of AI Control Tower; OpenLLMetry stays open source |
| Galileo | Cisco (Splunk) | Announced April 9, closed May 22, 2026 | Galileo’s pricing page now redirects to Splunk pricing |
| Portkey | Palo Alto Networks | Closed May 29, 2026 | Becomes the AI gateway inside Prisma AIRS |
Buyer’s rule: before signing an annual contract, get a written export path for traces and eval datasets. OpenTelemetry instrumentation is the cheapest insurance against an unplanned acquisition.
The 12 Best AI Agent Observability Tools, Reviewed
The reviews below are ordered by how many teams each tool fits well, starting with the broadest default. Each one covers what the tool is, its key features, pricing as listed on the vendor’s site on October 11, 2026, honest pros and cons, and the team it suits best, so every section can stand alone.
1. Langfuse: best open-source default for most teams
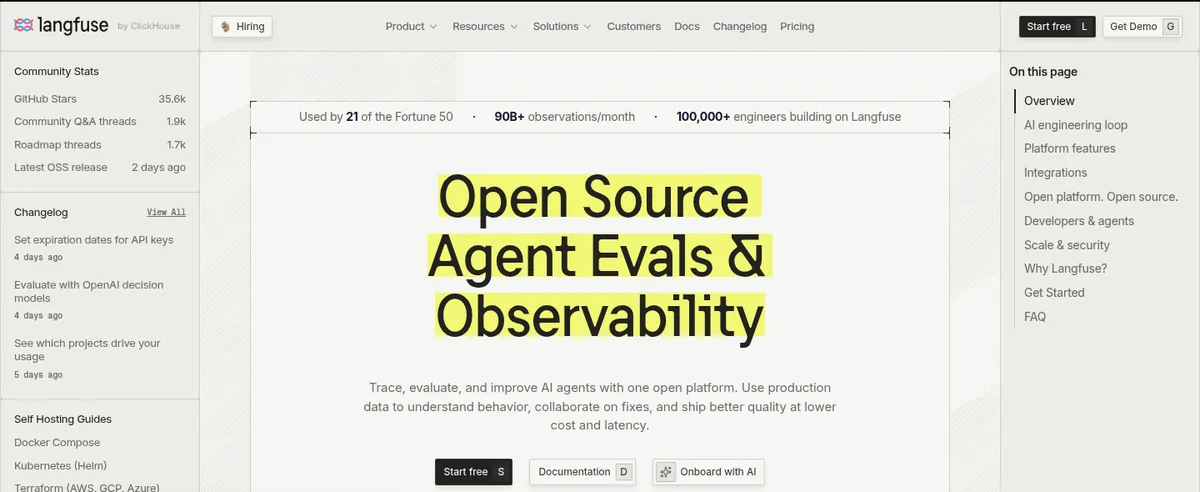
Verdict: Langfuse is the safest default for teams that want tracing, evals, prompts, and alerts in one tool.
Langfuse is an open-source LLM engineering platform for tracing, evaluating, and monitoring agents. ClickHouse acquired it in January 2026.
Its license file keeps the core under MIT, with enterprise features in separate ee folders. The repository had more than 35,000 GitHub stars in October 2026.
Key features
- Agent traces with graphs, session tracking for chats and threads, and token and cost tracking on every plan.
- Datasets, experiments, LLM-as-judge evaluators, and human annotation queues for offline and online evals.
- Alerts, webhooks, and Slack notifications, with 2 alerts on Hobby, 20 on Core, 50 on Pro, and 100 on Enterprise.
Pricing
- Hobby is free, with 50,000 units per month, 2 users, and 30 days of data access.
- Core costs $29 per month for 100,000 units and unlimited users, then $8 per 100,000 units, falling to $6 above 50 million.
- Pro costs $199 per month and adds 3 years of data access, SOC 2 Type II and ISO 27001 reports, and a HIPAA BAA.
- Enterprise starts at $2,499 per month.
Prices come from Langfuse pricing. Langfuse counts every trace, span, and score as a unit, so one agent run with 20 spans uses 21 units before any scores.
Pros and cons
Pros
- Self-hosting is free, and Langfuse says it runs at the same scale as Langfuse Cloud.
- Unlimited users from the $29 Core plan avoid per-seat costs for large teams.
Cons
- A production self-host runs Postgres, ClickHouse, Redis or Valkey, and S3-compatible storage, according to the self-hosting guide.
- Langfuse observes and scores agent behavior; it does not block a risky call before it runs.
2. LangSmith: best for LangChain and LangGraph agents
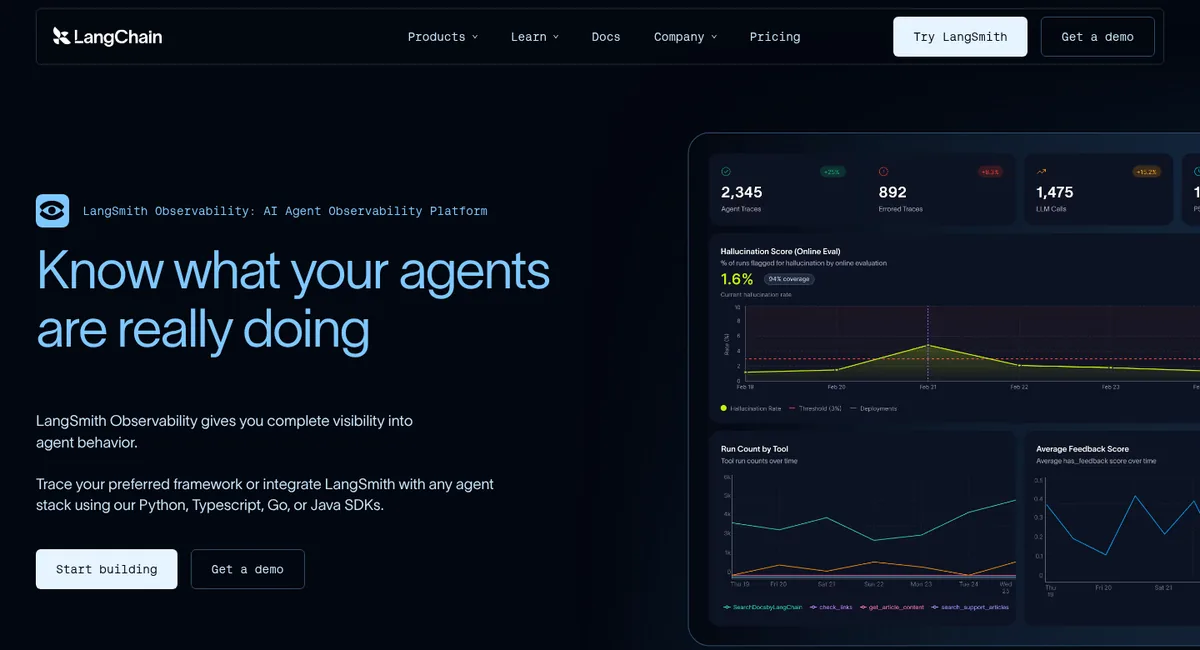
Verdict: LangSmith is the most natural fit for agents built on LangChain or LangGraph.
LangSmith is LangChain’s commercial platform for agent observability, evaluation, and deployment. It traces applications through Python, TypeScript, Go, and Java SDKs and accepts traces at an OpenTelemetry endpoint.
It also works with the OpenAI SDK, Anthropic SDK, Vercel AI SDK, and LlamaIndex.
Key features
- Step-by-step agent traces with cost tracking and tool and trajectory monitoring.
- Online LLM-as-judge and code evals on production traffic, plus offline evals on datasets.
- Alerts through webhooks and PagerDuty when latency, error, cost, or feedback metrics cross a threshold.
- LangSmith Engine, which runs every 6 hours to cluster agent failures and propose evals, at roughly 7 to 45 LangChain Standard Units per run and $1 per unit.
Pricing
- Developer is free for 1 seat and 5,000 base traces per month.
- Plus costs $39 per seat per month with 10,000 base traces included, then pay as you go.
- Enterprise adds self-hosted and hybrid deployment, custom SSO, RBAC, and a support SLA at custom pricing.
Prices come from LangSmith pricing. Base traces are kept 14 days and extended traces 180 days for an added fee, and the regions FAQ states SOC 2 Type 2 certification and HIPAA compliance.
Pros and cons
Pros
- The deepest LangGraph-aware tracing of any tool in this guide.
- Engine automates part of the triage that other tools leave to engineers.
Cons
- Every invited user counts as a billable seat, which adds up for large teams.
- Self-hosting requires an Enterprise contract.
Already on LangSmith and weighing a move? Our LangSmith alternatives guide compares 8 replacements on self-hosting, licence, and the same-workload bill.
3. Arize Phoenix and Arize AX: best for OpenTelemetry-first teams
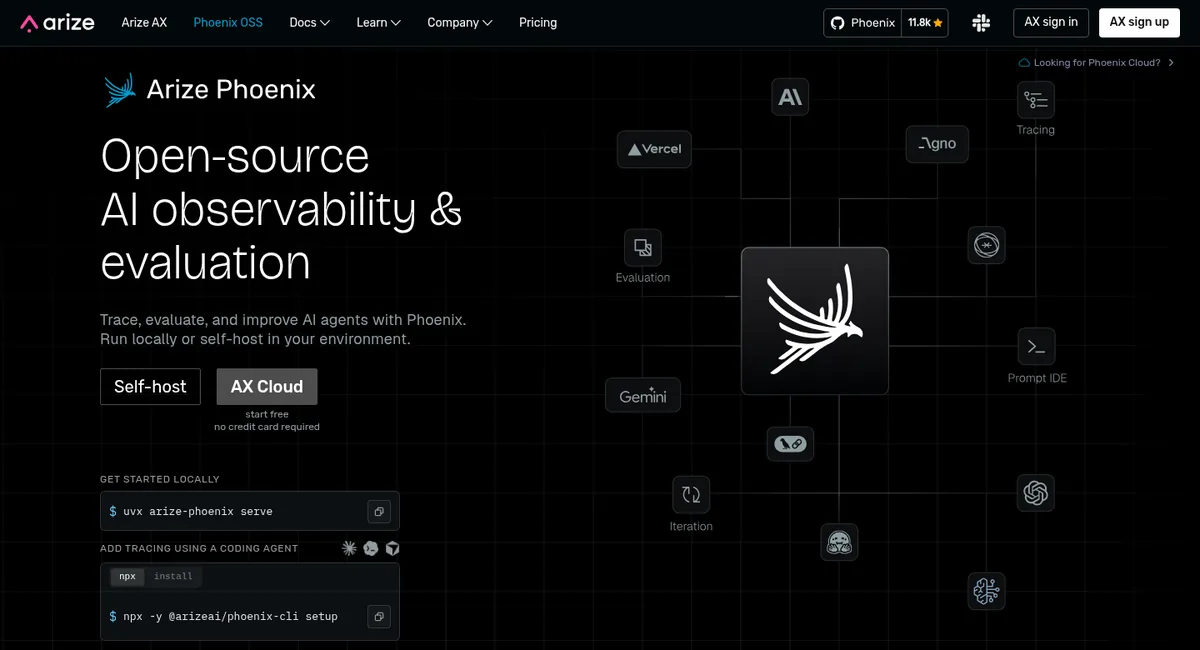
Verdict: Arize suits teams that want OpenTelemetry-native tracing they can run locally for free, with a managed upgrade path.
Arize Phoenix is a local-first platform for tracing, evaluation, experiments, and prompt iteration, released under the Elastic License 2.0. Arize AX is the company’s managed platform.
Both use OpenInference, Arize’s Apache 2.0 instrumentation conventions built on OpenTelemetry.
Key features
- OpenTelemetry-compliant tracing with token, latency, and cost tracking and agent trajectory views in path and graph form.
- Online evals on traces and offline evals on datasets, unlimited on every AX plan.
- Custom dashboards and custom monitors in AX.
Pricing
- Phoenix is free to self-host.
- AX Free includes 25,000 spans, 1 GB of ingestion, and 15-day retention with unlimited users.
- AX Pro costs $50 per month for 50,000 spans, 10 GB, and 30-day retention, with SOC 2 Type II.
- AX Enterprise is custom priced and adds self-hosted deployment, SSO, audit logs, and HIPAA.
Prices come from Arize pricing. AX Pro’s 50,000 spans run out at 2,000 agent runs per month if each run emits 25 spans.
Pros and cons
Pros
- Free local tracing with no metered events.
- Strong retrieval and trajectory evals for RAG-heavy agents.
Cons
- The Elastic License 2.0 is source-available rather than OSI-approved open source, and it bars offering Phoenix as a managed service.
- Monitors live in the managed AX product, so self-hosted Phoenix users need another alerting path.
4. Braintrust: best for eval-driven release workflows
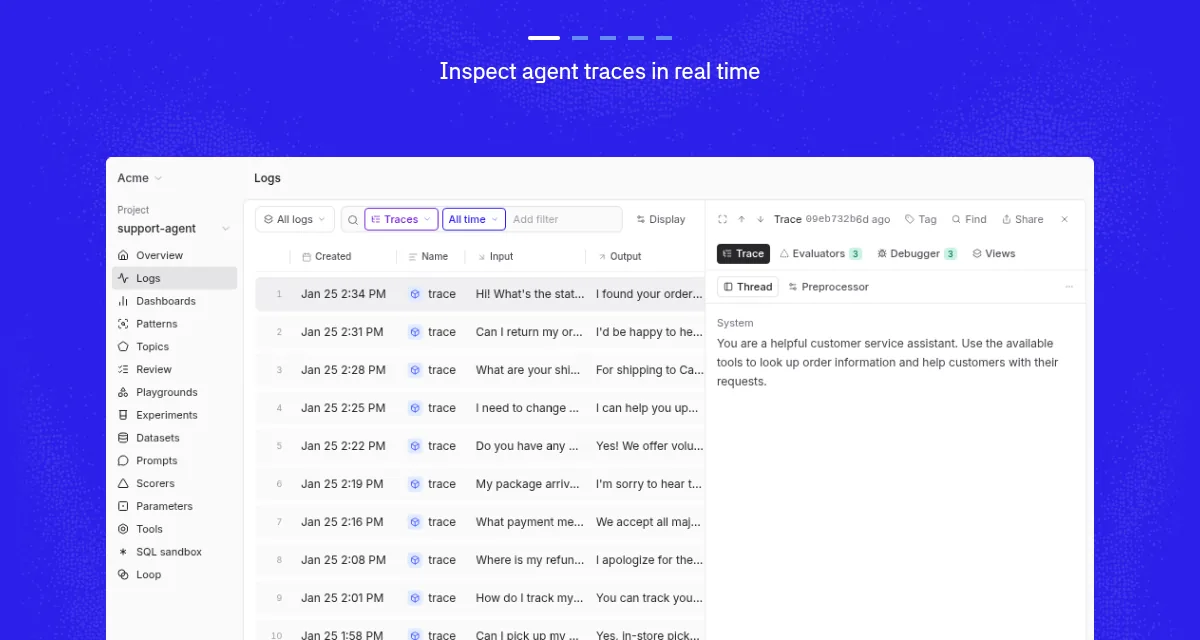
Verdict: Braintrust fits teams where evals decide what ships.
Braintrust is a proprietary evaluation and observability platform built around versioned datasets, experiments, scorers, and release environments. It accepts OpenTelemetry traces through an OTLP endpoint and span processors.
Key features
- Online scoring of production traces, spans, or groups, with sampling and filters.
- Alerts written as SQL conditions, time-window aggregations, or environment change rules, such as a factuality score below 0.8 in production.
- Estimated cost per trace calculated from token counts and model pricing, queryable in dashboards.
Pricing
- Starter is free with $10 in credits, 1 GB of processed data, 10,000 scores, 14-day retention, and unlimited users.
- Pro costs $249 per month with $100 in credits, 5 GB, 50,000 scores, and 30-day retention, then $3 per GB and $1.50 per 1,000 scores.
- Enterprise is custom priced with on-prem or hosted deployment.
Prices come from Braintrust pricing, which also lists SOC 2 Type II compliance.
Pros and cons
Pros
- Unlimited users on every plan, including the free one.
- Alerts can fire directly on eval scores, which closes the trace-to-alert loop for quality.
Cons
- Billing on processed gigabytes plus scores takes modeling to forecast.
- The platform is closed source, and on-prem deployment is Enterprise only.
5. Datadog Agent Observability: best for teams already on Datadog
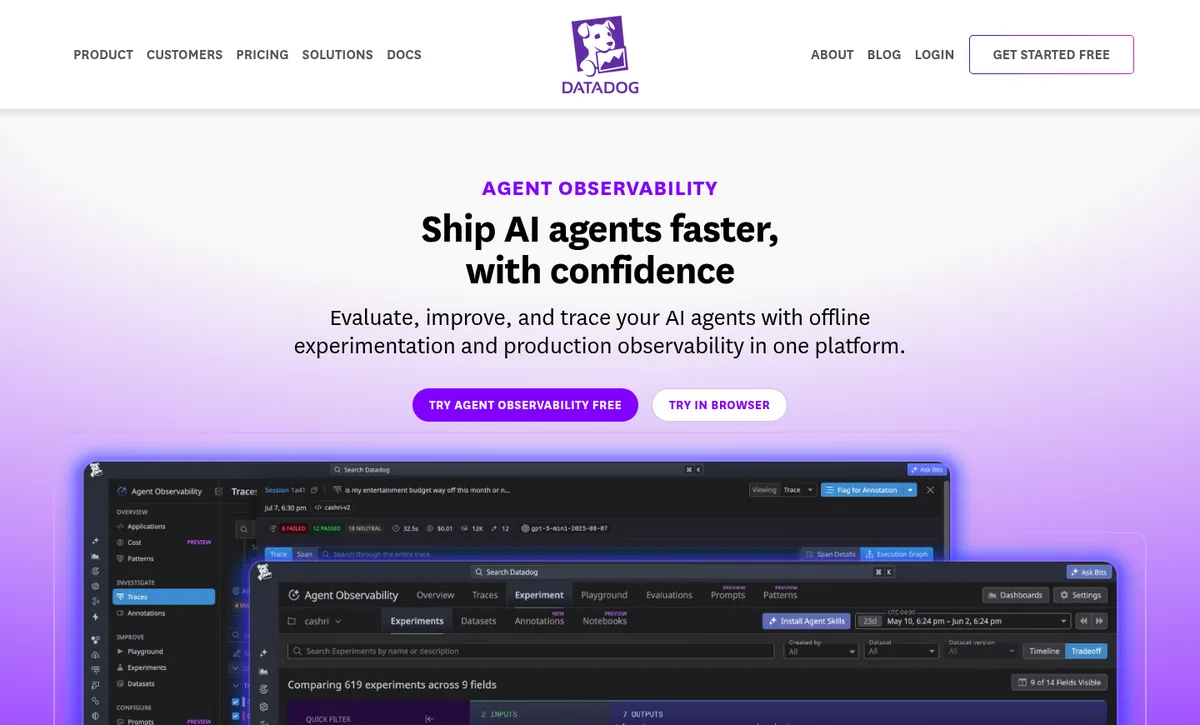
Verdict: Datadog Agent Observability is the practical choice when Datadog already holds your metrics, logs, and APM traces.
Datadog Agent Observability traces LLM applications and agents inside the Datadog platform and is sold as a standalone product. It natively accepts OpenTelemetry GenAI semantic convention spans from version 1.37, so teams can send OTLP data without the Datadog SDK.
Key features
- Tracing, evaluations, playground, datasets, experiments, annotations, and dashboards on every tier.
- ml_obs metrics for span counts, errors, tokens, latency, and cost, sampled at 100% and usable in standard Datadog monitors.
- AI Guard, a separately billed product, blocks prompt injection and tool misuse inline.
Pricing
- The free tier covers up to 40,000 LLM spans per month with 15-day retention.
- Pro costs $160 per month on annual billing, $200 month to month, or $240 on demand for 100,000 LLM spans.
- Extra volume costs $3.50 per 10,000 LLM spans on annual billing.
Prices come from Datadog pricing. Datadog does not bill tool, workflow, or retrieval spans; it bills only calls to the model.
Pros and cons
Pros
- Billing on LLM spans alone favors agents that make many tool calls per run.
- One platform for agent, application, and infrastructure telemetry.
Cons
- Eval scores sit outside the ml_obs metric set, so quality alerting works differently from cost and latency alerting.
- Datadog is SaaS, so teams that require self-hosting need another tool.
6. Galileo: best for regulated enterprises that need guardrails
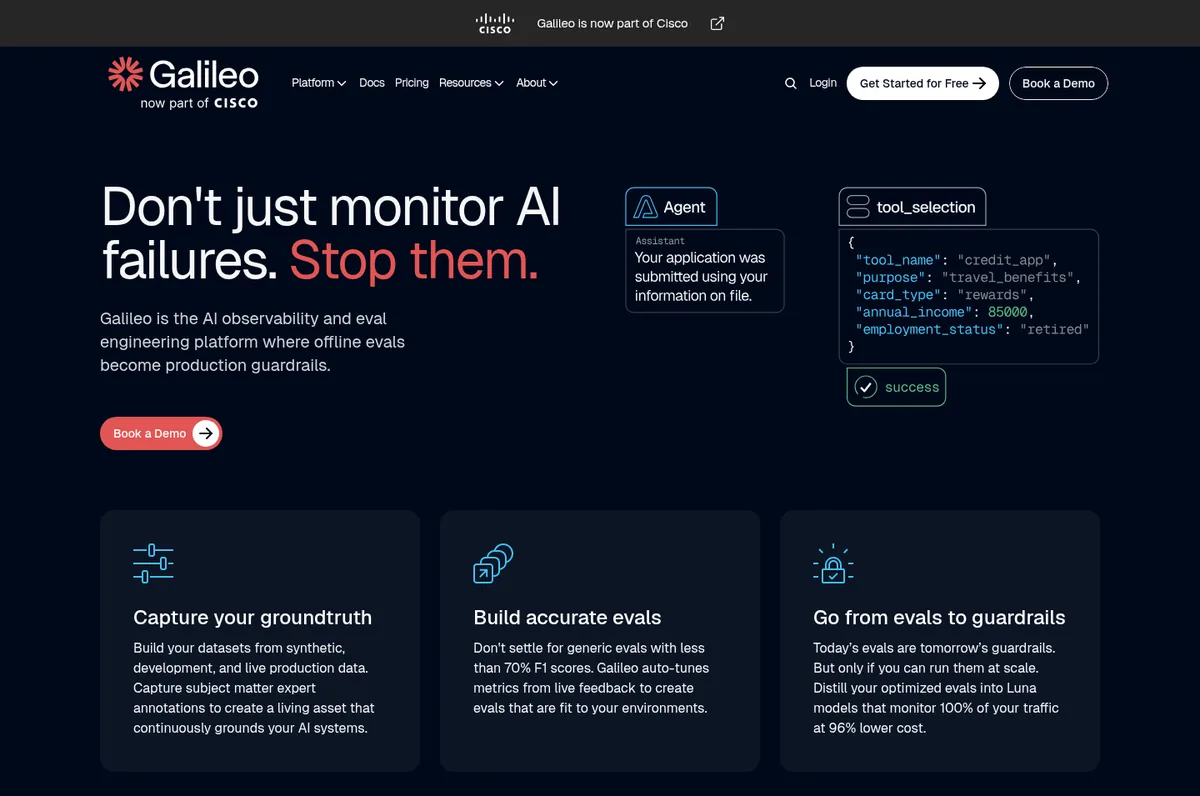
Verdict: Galileo is the strongest fit for regulated enterprises that want evals to become runtime guardrails.
Galileo is an AI observability and eval engineering platform that distills LLM-as-judge evaluators into small Luna models, so teams can score all production traffic. Cisco completed its acquisition of Galileo on May 22, 2026 and added it to the Splunk Observability portfolio.
Key features
- More than 20 prebuilt evals for RAG, agents, safety, and security, plus custom evaluators.
- Luna models that Galileo says monitor 100% of traffic at 96% lower cost than LLM judges, an untested vendor claim.
- Guardrail policies that block harmful responses and control agent actions based on eval scores.
- Alerts on log-stream metrics by aggregation, threshold, and time window, sent to email or Slack, with OpenTelemetry and OpenInference ingestion.
Pricing
- Galileo’s pricing page now redirects to Splunk.
- Splunk Agent Observability starts at $100 per month per 1.2 million spans, billed annually.
- That price includes 500 million Luna tokens and 5 Luna fine-tuning runs per year.
Prices come from Splunk pricing. Galileo offers SaaS, virtual private cloud, and on-premises deployment, and its trust page states SOC 2 Type II certification. We compare Galileo’s current Splunk pricing with Braintrust and Maxim in Braintrust vs Maxim vs Galileo.
Pros and cons
Pros
- The eval-to-guardrail lifecycle is the most complete in this guide.
- Deployment options cover SaaS, VPC, and on-premises.
Cons
- Packaging and pricing are moving into Splunk, so confirm the current SKU before you budget.
- Published pricing assumes annual billing, and the platform is proprietary.
7. Opik by Comet: best budget pick with full open-source features
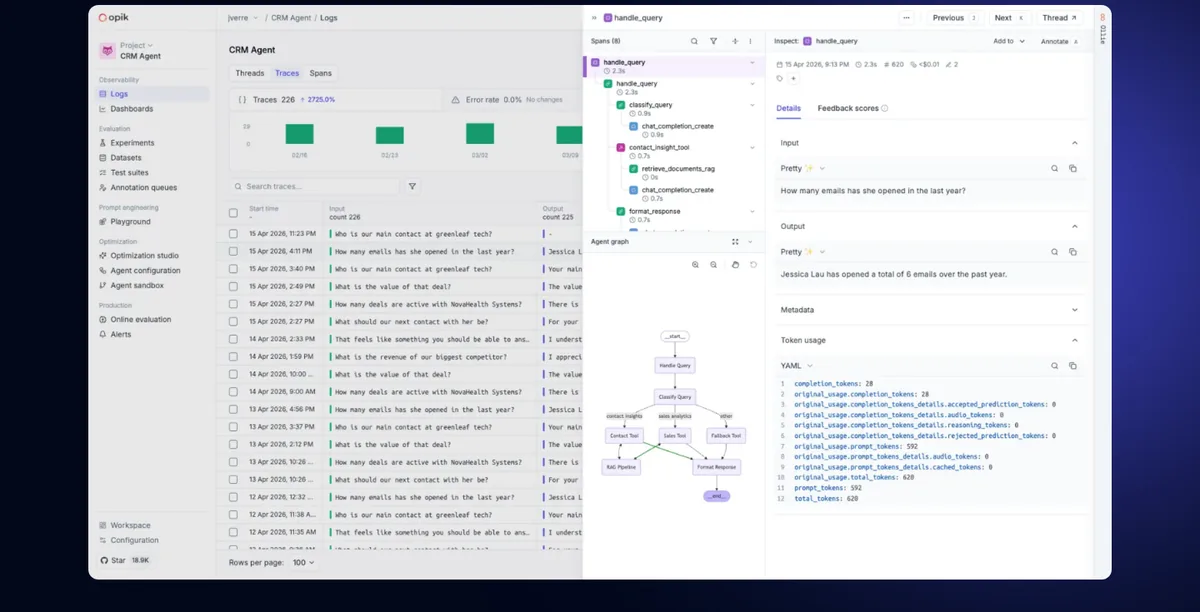
Verdict: Opik gives budget-conscious teams the full feature set in open source, plus the cheapest paid cloud plan in this guide.
Opik is Comet’s open-source GenAI observability and evaluation platform, licensed under Apache 2.0. Its hosted versions run the same codebase, and the repository had about 22,500 GitHub stars in October 2026.
Key features
- Agent tracing, execution graphs, sessions, and token and cost tracking, with more than 40 integrations including LangGraph, CrewAI, and Google ADK.
- Test suites with pass or fail assertions, more than 30 built-in metrics, and online evaluation of production traces.
- Webhook alerts on trace errors, feedback scores, and prompt changes, plus PII and topic guardrails on self-hosted deployments.
Pricing
- The open-source version is free with no usage caps.
- Free Cloud includes 25,000 spans per month, 10 team members, and 60-day retention.
- Pro Cloud costs $19 per month for 100,000 spans and 50 members, then $5 per 100,000 spans.
- Enterprise is custom priced and adds SSO, RBAC, and SOC 2, ISO 27001, and HIPAA compliance.
Prices come from Comet pricing.
Pros and cons
Pros
- The lowest entry paid price among the 12 tools.
- A permissive Apache 2.0 license with no feature gap between open source and cloud.
Cons
- Free and Pro Cloud store data in the US only.
- RBAC and SSO require the Enterprise plan, and guardrails run only on self-hosted deployments.
8. MLflow: best for teams already on MLflow or Databricks
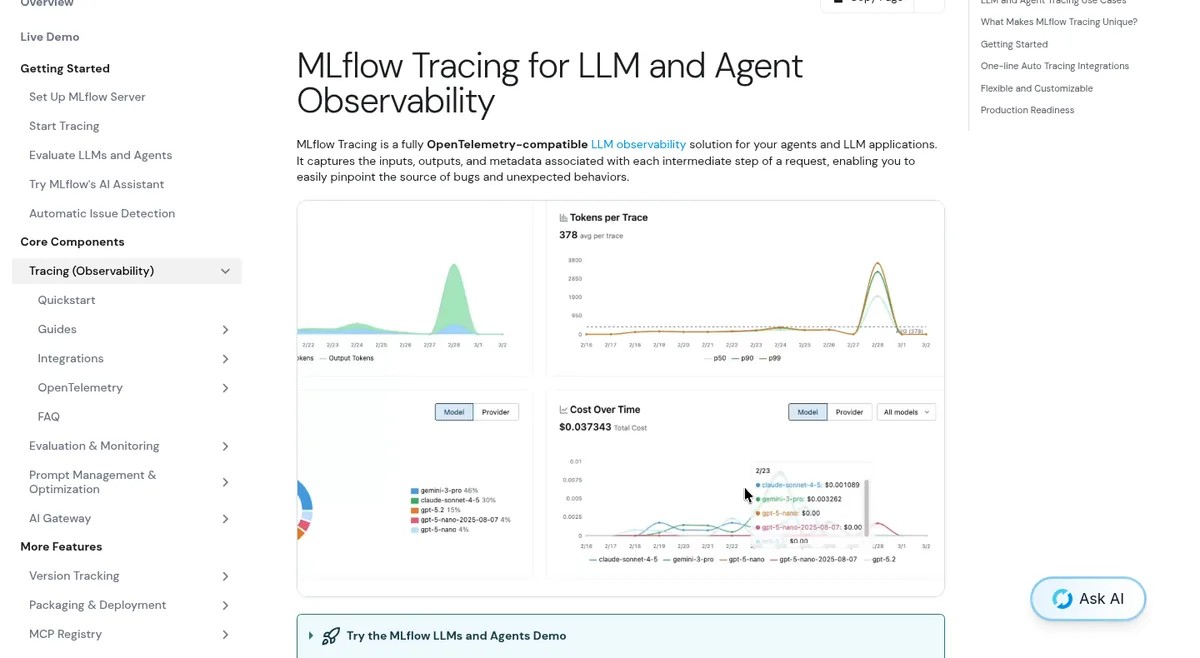
Verdict: MLflow is the logical choice for teams that already track models in MLflow or Databricks.
MLflow is an Apache 2.0 platform for the machine learning and GenAI lifecycle. MLflow Tracing is its fully OpenTelemetry-compatible observability layer for agents.
Version 3.17.0 shipped on October 7, 2026, and the repository had more than 28,000 GitHub stars that month.
Key features
- Traces that capture inputs, outputs, and metadata for every intermediate step, viewable in an IDE, a notebook, or the MLflow UI.
- Token usage tracking from version 3.2 and per-call cost tracking from version 3.10.
- Evaluation, human feedback, prompt management, and an AI gateway in the same project.
Pricing
- MLflow is free to self-host.
- Managed MLflow is available through Databricks and other cloud providers, which set their own pricing.
Managed pricing varies by provider, so check Databricks pricing if you run there.
Pros and cons
Pros
- Free and permissively licensed, with a large contributor community.
- Agent traces sit next to experiment tracking and the model registry.
Cons
- Open-source MLflow has no native alerting. An open feature request from June 2026 asks for Slack alerts, so teams script checks today.
- Running and scaling the tracking server is your team’s job unless you buy a managed service.
9. W&B Weave: best for ML teams on Weights & Biases
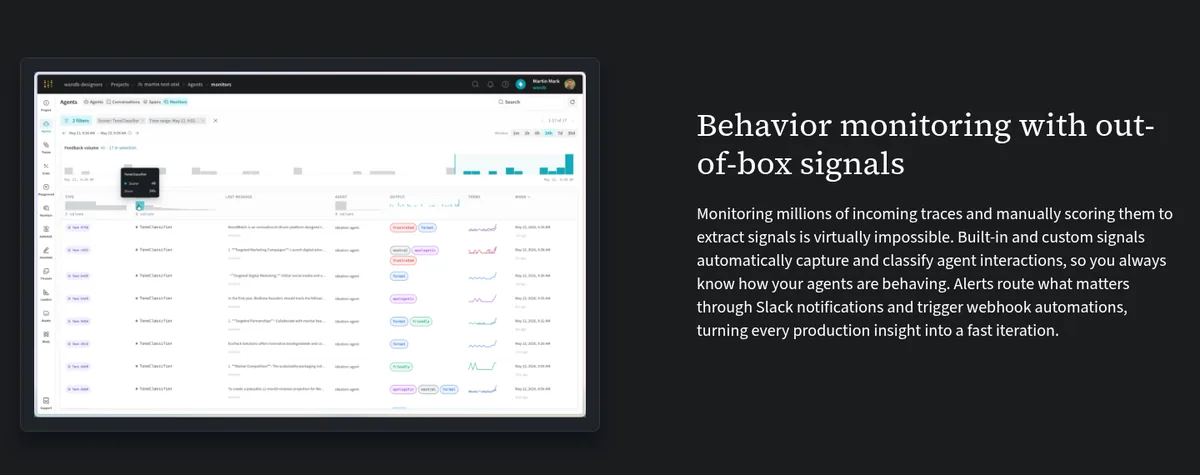
Verdict: W&B Weave suits ML teams that want agent traces next to their model experiments.
W&B Weave is the Weights & Biases toolkit for tracing and evaluating LLM applications and agents. It is now sold as part of CoreWeave Forge, since CoreWeave acquired Weights & Biases.
The SDK is Apache 2.0 licensed, and Weave accepts OTLP traces, including spans routed to a dedicated Agents view.
Key features
- Tracing, evaluations, scorers, and production monitoring for LLM applications and agents.
- Cost tracking and PII data redaction.
- Slack and email alerts and CI/CD automations on the Pro plan.
Pricing
- Free costs $0 with 1 GB of Weave ingestion per month.
- Pro starts at $60 per month with 1.5 GB of ingestion and $0.10 per additional MB, for companies with fewer than 50 employees.
- Enterprise is custom priced at $0.20 per additional MB, with SSO, audit logs, and a HIPAA option.
Prices come from CoreWeave Forge pricing, which also lists SOC 2 Type II.
Pros and cons
Pros
- Agent traces live beside training runs and model artifacts.
- Free academic licenses include up to 25 GB of Weave ingestion per month.
Cons
- At $0.10 per MB, each extra gigabyte on Pro costs about $100.
- Pro is closed to companies with 50 or more employees.
10. Laminar: best for browser agents and coding agents
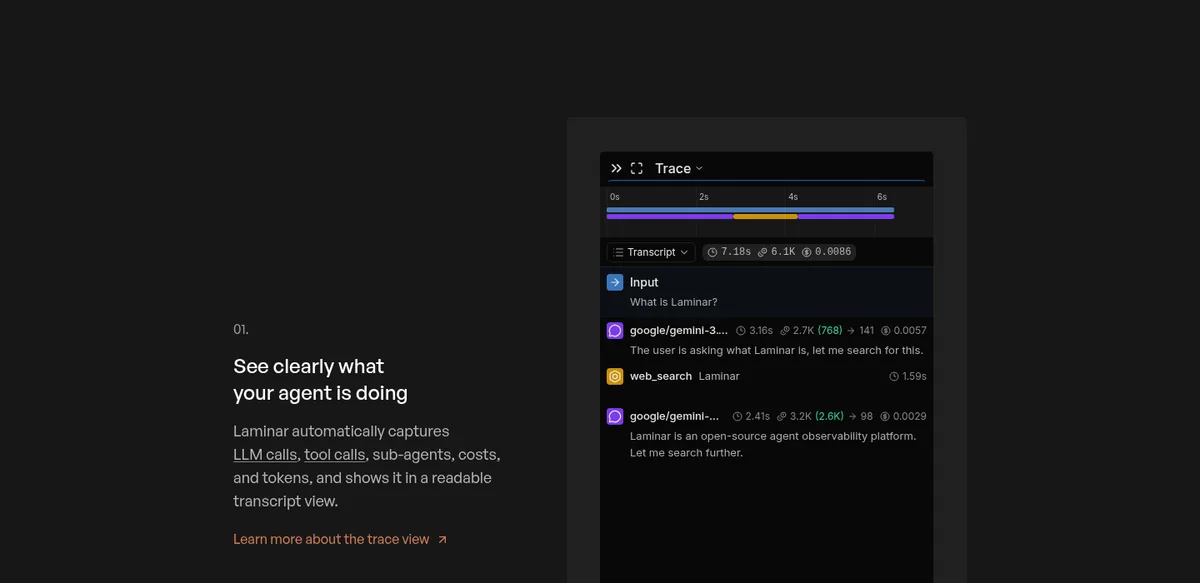
Verdict: Laminar is the best fit here for browser and coding agents that need replayable sessions.
Laminar is an open-source observability platform for AI agents, licensed under Apache 2.0 and backed by Y Combinator. It ingests traces over OTLP and integrates with the Claude Agent SDK, OpenAI Agents SDK, Browser Use, Stagehand, and Playwright.
Key features
- Browser session recording linked to agent traces.
- Signals, an internal analysis agent that clusters events across traces.
- A SQL editor, full-text trace search, and custom dashboards.
- Slack and email alerts, evaluations, datasets, labeling queues, and server-side PII removal.
Pricing
- Free includes 1 GB of data, 7-day retention, and 1 seat.
- Starter costs $30 per month for 3 GB and 30-day retention, then $2 per GB.
- Pro costs $150 per month for 10 GB and 6-month retention, then $1.50 per GB.
- Signals bills separately at $0.05 per million input tokens and $0.30 per million output tokens.
Prices come from Laminar pricing. Enterprise adds on-premises deployment, and the pricing page lists SOC 2 Type II and HIPAA.
Pros and cons
Pros
- Session replay for browser agents is rare among these tools.
- Six months of retention on the $150 Pro plan.
Cons
- A smaller community, with about 3,400 GitHub stars in October 2026.
- Signals adds a second usage meter to forecast.
11. HoneyHive: best for enterprise agent regression testing
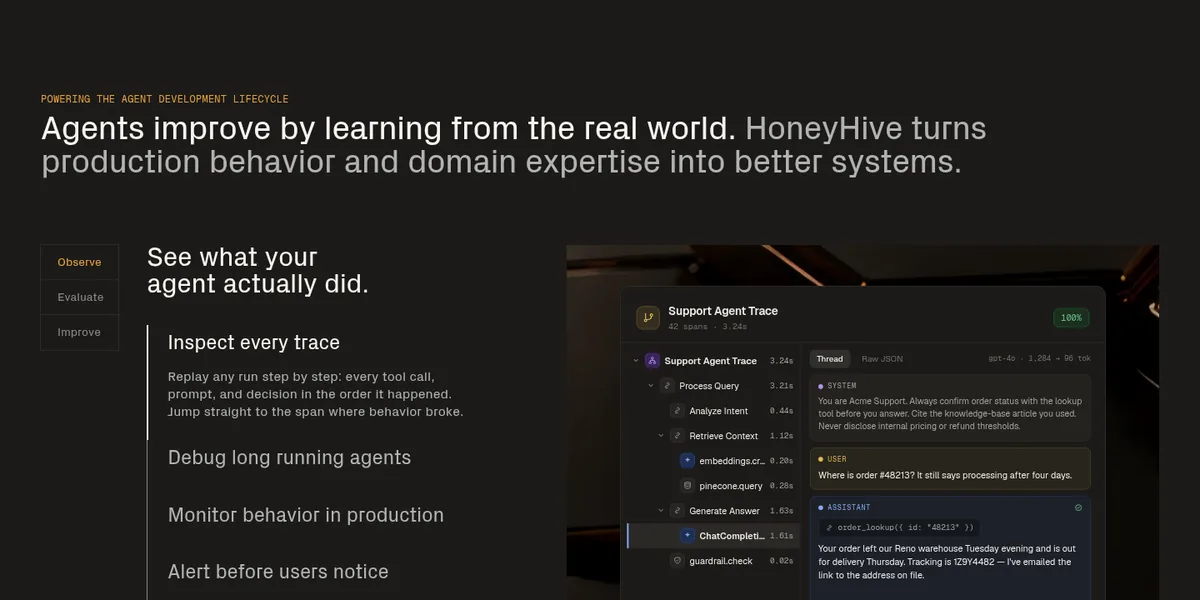
Verdict: HoneyHive fits enterprises that need regression testing, online evals, and flexible hosting under one contract.
HoneyHive is a proprietary AI observability and evaluation platform whose SDK wraps an OpenTelemetry TracerProvider, so any OpenTelemetry-compatible instrumentor works with it.
HoneyHive says it powers observability and evaluation for agents serving 17 million retail consumers at Commonwealth Bank of Australia.
Key features
- Tracing of prompts, tool calls, outputs, and handoffs.
- Online evaluations of quality and safety on live production traffic.
- Monitoring of quality, cost, latency, and usage, with alerts on behavior drift.
- Experiments, regression datasets from production cases, annotation queues, and prompt management.
Pricing
- Developer is free with 10,000 events per month, up to 5 users, and 30-day retention.
- Enterprise is custom priced and adds unlimited users, SAML SSO, custom retention, a BAA, and self-hosted, hybrid, or single-tenant deployment.
Prices come from HoneyHive pricing, and HoneyHive announced SOC 2 Type II, GDPR, and HIPAA compliance.
Pros and cons
Pros
- Hosting options include self-hosted, hybrid, and single-tenant.
- A named large-bank deployment gives procurement a reference point.
Cons
- No self-serve paid tier sits between the free plan and Enterprise.
- The 10,000-event free cap is low for production agents.
12. Traceloop and OpenLLMetry: best for vendor-neutral instrumentation
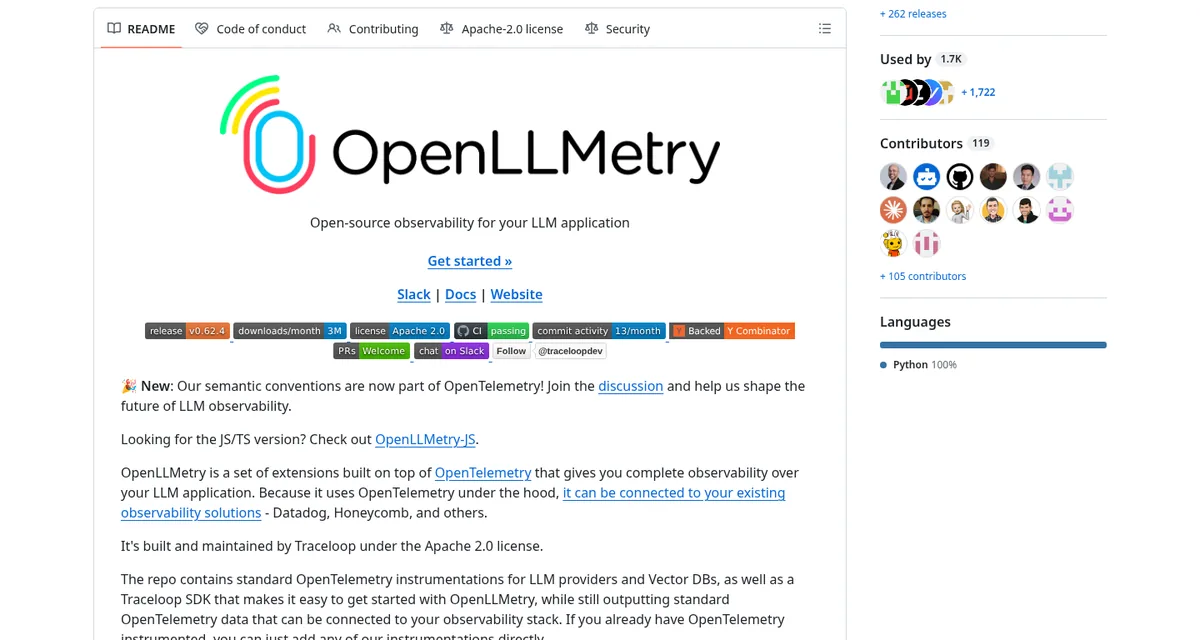
Verdict: Traceloop’s OpenLLMetry is the right layer for teams that want OpenTelemetry instrumentation they can point at any backend.
OpenLLMetry is an Apache 2.0 instrumentation framework for LLM applications built on OpenTelemetry. Traceloop is the observability and evaluation platform built on top of it.
Traceloop announced in March 2026 that it is joining ServiceNow’s AI Control Tower and that OpenLLMetry will stay open source. Calcalist reported the deal at $60 million to $80 million.
Key features
- Instrumentation that exports to more than 25 observability platforms, according to Traceloop.
- A platform with monitoring and evaluation dashboards, CI/CD integration, and prompt management.
- Built-in quality checks such as faithfulness and relevance, plus custom evaluators and drift detection.
Pricing
- The free plan covers up to 50,000 spans per month, 5 seats, and 24-hour data retention.
- Enterprise is custom priced and adds unlimited seats, custom retention, SOC 2 compliance, and on-premises deployment.
Prices come from Traceloop pricing.
Pros and cons
Pros
- Instrument once and change backends later without rewriting code.
- OpenLLMetry is permissively licensed and widely reused by other vendors.
Cons
- The commercial platform’s roadmap now follows ServiceNow’s priorities.
- The free plan keeps data for only 24 hours, and public pages do not detail alerting.
Feature Matrix: How the 12 Tools Compare on Our Criteria
The matrix below compares all 12 AI agent observability tools on tracing, OpenTelemetry, evals, alerting, cost tracking, self-hosting, pricing model, and compliance. Values come from vendor documentation reviewed on October 11, 2026, and cells say not documented when we could not find the capability on the vendor’s public pages.
| Tool | Agent tracing | OpenTelemetry | Evals | Native alerts | Cost tracking | Self-host and license | Pricing model | Compliance |
|---|---|---|---|---|---|---|---|---|
| Langfuse | Traces, agent graphs, sessions | Native ingestion | Online, offline, judge, human queues | Yes, 2 to 100 by plan | Yes | Free, MIT core | Units, from $29/mo | SOC 2 Type II, ISO 27001 (Pro) |
| LangSmith | Traces, trajectories, LangGraph-aware | OTLP endpoint | Online and offline | Webhooks, PagerDuty | Yes | Enterprise only, closed | Seats plus traces | SOC 2 Type 2, HIPAA |
| Arize Phoenix and AX | Paths, graphs, sessions | Native, OpenInference | Online and offline, unlimited | Custom monitors (AX) | Yes | Phoenix free, Elastic 2.0 | Spans and GB, from $50/mo | SOC 2 Type II (AX Pro and up) |
| Braintrust | Traces and spans | OTLP endpoint | Online scoring, experiments | SQL and time-window alerts | Estimated cost | Enterprise on-prem, closed | GB plus scores, from $249/mo | SOC 2 Type II |
| Datadog | LLM, tool, workflow spans | Native GenAI conventions | Included on all tiers | Datadog metric monitors | ml_obs cost metrics | No, SaaS | LLM spans, from $160/mo | Datadog platform controls |
| Galileo | Traces with failure insights | OTel and OpenInference | 20+ prebuilt, custom, Luna | Email and Slack | Cost metrics | VPC or on-prem, closed | Spans, annual (Splunk) | SOC 2 Type II |
| Opik | Traces, graphs, sessions | Native | Test suites, online evals | Webhooks | Yes | Free, Apache 2.0 | Spans, from $19/mo | SOC 2, ISO 27001 (Enterprise) |
| MLflow | Step-level traces | Fully compatible | Evaluation, feedback | Not native in open source | Yes (3.10+) | Free, Apache 2.0 | Free; managed varies | Depends on managed provider |
| W&B Weave | Traces, Agents view | OTLP endpoint | Evals and scorers | Slack and email (Pro) | Yes | Private hosting (Enterprise); SDK Apache 2.0 | Ingested bytes, from $60/mo | SOC 2 Type II |
| Laminar | Traces plus browser recordings | OTLP ingestion | Evals, datasets, labeling | Slack and email | Yes | Free, Apache 2.0 | GB, from $30/mo | SOC 2 Type II, HIPAA listed |
| HoneyHive | Prompts, tools, handoffs | OpenTelemetry-native SDK | Online and offline | Drift alerts | Yes | Enterprise self-host, closed | Events; Enterprise custom | SOC 2 Type II, HIPAA |
| Traceloop | Traces via OpenLLMetry | Built on OpenTelemetry | Built-in and custom | Not documented | Not documented | OpenLLMetry Apache 2.0; platform on-prem (Enterprise) | Spans; Enterprise custom | SOC 2 (Enterprise) |
Langfuse, Braintrust, Galileo, Laminar, and HoneyHive close the trace-to-alert loop natively. Each can alert on quality or cost signals inside the same product that stores the traces.
MLflow and Traceloop need external alerting, and Arize keeps monitors in managed AX. Datadog closes the loop for cost, latency, and errors, while quality signals follow a separate path.
How to Choose an Agent Observability Tool for Your Team
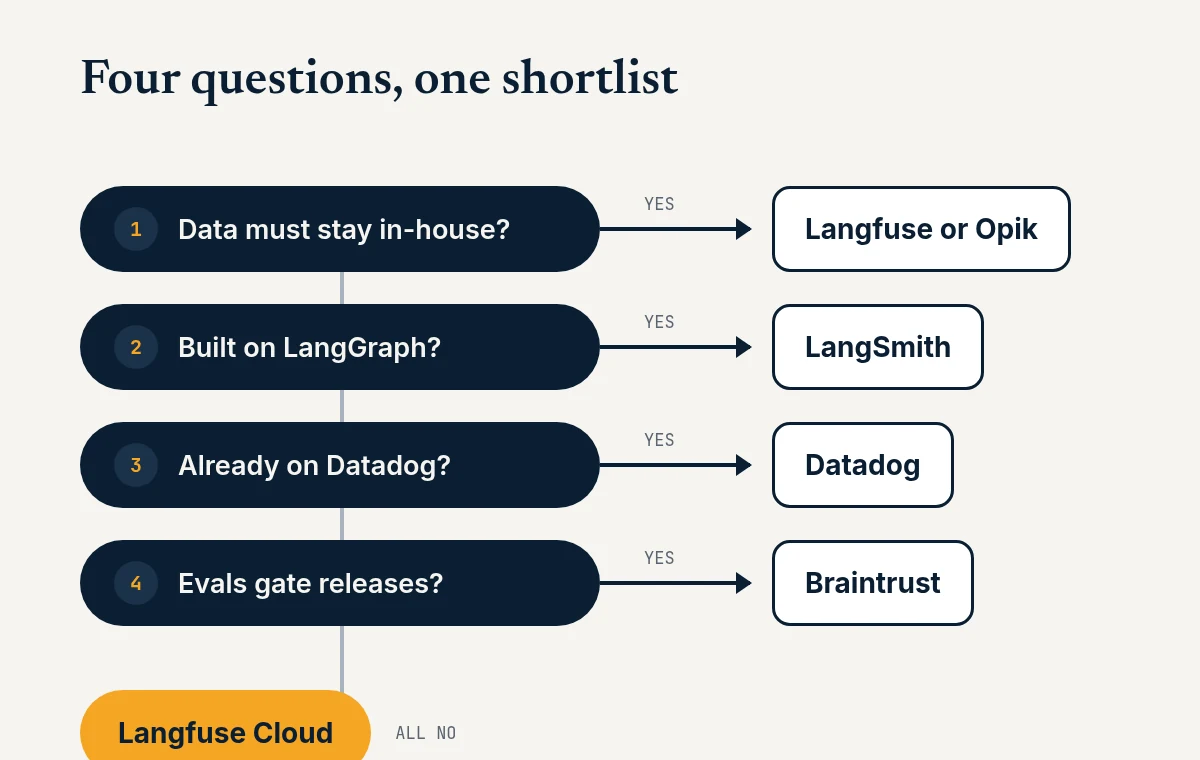
Start from three constraints in this order: where trace data is allowed to live, which framework and monitoring stack you already run, and whether evals or dashboards drive your release decisions. Those three answers remove most of the list before you compare features, and the flowchart below turns them into a shortlist.
Startups and small teams shipping a first agent
Langfuse Hobby or Core and Opik Free Cloud cover tracing, evals, and basic alerts for $0 to $29 per month as of October 2026. Upgrade when you outgrow 30 days of Langfuse history or 25,000 Opik spans per month.
Platform teams with data residency rules
Self-hosted Langfuse and Opik are the strongest free options, and Phoenix works if you never plan to resell it as a hosted service. For vendor-supported self-hosting, compare HoneyHive, Galileo, and LangSmith Enterprise on custom contracts.
LangChain and LangGraph teams
LangSmith is the shortest path for LangGraph agents, since its traces understand graph state and node structure. Langfuse is the better choice for a LangGraph team that needs self-hosting without an enterprise contract.
Enterprises already on Datadog
Datadog keeps agent telemetry next to APM and infrastructure data, and its LLM-span billing stays predictable for tool-heavy agents. Pair it with Braintrust or Langfuse when you need prompt management or dataset-driven evals.
Eval-driven product teams
Braintrust suits teams that treat eval scores as release gates and want alerts on those scores. Galileo fits when eval results must also block unsafe output at runtime, and HoneyHive suits enterprises that need regression suites built from production cases.
Evals are the deciding factor? Our AI agent evaluation tools guide compares 10 options on tool-call scoring, online evals, and CI gates.
Run a two-week bake-off before you buy
A shortlist of two tools tested on one real agent beats any feature matrix, including ours. Follow these five steps.
- Instrument one production agent with OpenTelemetry, using OpenLLMetry or OpenInference, so the same spans can go to any backend.
- Use an OpenTelemetry Collector to export the same traces to both shortlisted tools at once.
- Write three evals from real failures your team has already seen, and run them online on both tools.
- Create one alert on cost per run and one on an eval score, then check how long each tool takes to fire.
- Price both tools at three times your current monthly span volume using the vendors’ published rates.
If you are also mapping the layer in front of your models, our AI gateways coverage explains where routing and policy tools fit next to observability.
Disqualifier: no observability tool fixes an agent without a written definition of success. Write that rubric first, since every eval and alert depends on it.
Tools We Reviewed but Left Off This List
We reviewed several well-known tools that did not make the final 12, mostly because their status changed in 2026 or because their public pages did not let us verify pricing and scope. Each still has users, and the notes below explain why we did not rank them in this edition.
- Helicone: Mintlify acquired it on March 3, 2026, and it moved into maintenance mode with fixes and new models but no new features.
- Portkey: Palo Alto Networks closed its acquisition on May 29, 2026 and made Portkey the AI gateway inside Prisma AIRS, so it belongs with AI gateways.
- AgentOps: AgentOps lists a free tier of 5,000 events and Pro from $40 per month, but its latest Python release on PyPI is 0.4.21 from August 2025.
- Maxim AI: its pricing page describes only the Bifrost gateway, so we could not verify observability pricing.
- General APM suites: New Relic, Dynatrace, and Honeycomb were out of scope, but they belong on your shortlist if one already runs production.
Comparing exits from Langfuse? See 7 Best Langfuse Alternatives.
When cost per seat or per unit starts driving the shortlist, see the LangSmith vs Langfuse vs Braintrust pricing breakdown.
Some tools on this list, such as Helicone, also sit in the request path as gateways. For routing, spend caps, and failover, see 9 Best LLM Gateways for Enterprise AI Teams.
Gateway choice sits next to tracing. For Portkey, LiteLLM, and OpenRouter side by side, see Portkey vs LiteLLM vs OpenRouter.
Tracing tells you what agents did. An MCP gateway decides which tools they can call before those spans ever fire.
Observability shows what agents did with tools. MCP Explained covers how Model Context Protocol servers and gateways shape which tools exist in the first place.
Frequently Asked Questions About Agent Observability Tools
Which AI agent observability tools are open source?
Langfuse (MIT core), Opik, MLflow, and Laminar (all Apache 2.0) are open source and free to self-host, and Traceloop’s OpenLLMetry instrumentation is Apache 2.0. Arize Phoenix is free to self-host under the Elastic License 2.0, which is source-available and bars offering Phoenix as a managed service. W&B Weave’s SDK is also Apache 2.0.
Do I need OpenTelemetry for agent observability?
You do not need OpenTelemetry, but it is the cheapest protection against lock-in. All 12 tools in this guide accept OpenTelemetry data, so instrumenting once with OpenTelemetry, OpenLLMetry, or OpenInference lets you change backends later. The GenAI agent span conventions are still marked Development, so pin the version you use.
How much do AI agent observability tools cost per month?
Entry paid plans ranged from $19 per month for Opik Pro Cloud to $249 per month for Braintrust Pro as of October 2026, and most tools add usage fees above an included allowance. An agent emits many spans per run, so estimate cost at three times your current traffic before you commit.
Can I use Datadog and Langfuse together?
Yes, an OpenTelemetry Collector can export the same agent spans to Datadog for infrastructure correlation and to Langfuse for prompt management and evals. Budget for both bills: Datadog charges only for LLM spans, while Langfuse counts every trace, span, and score as a billable unit on its cloud plans.
Is LangSmith only for LangChain applications?
No, LangSmith traces applications built with the OpenAI SDK, Anthropic SDK, Vercel AI SDK, LlamaIndex, or custom code through Python, TypeScript, Go, and Java SDKs, and it accepts OpenTelemetry traces. Its deepest integration is still with LangChain and LangGraph, and self-hosting LangSmith requires an Enterprise plan.
The Bottom Line: Match the Tool to Your Constraints, Then Test It
Langfuse is the best starting point for most teams in 2026, with an MIT core, OpenTelemetry ingestion, and native alerts at a $29 entry price. LangSmith, Datadog, and Braintrust each win inside their own conditions, and Galileo leads where evals must become guardrails. Instrument with OpenTelemetry so an acquisition cannot trap your data.
We update this guide every quarter, and vendors can send pricing or feature corrections through our contact page. For more on running agents in production, browse our agent observability coverage.
For a dedicated shortlist of tools you can run on your own servers, see our 8 best open source LLM observability tools you can self-host in 2026, compared on license, OpenTelemetry, Docker, and cost.
Related guides: the full AgentOps tools map, Langfuse vs LangSmith vs Braintrust, Braintrust vs Maxim vs Galileo, 8 Best Open Source LLM Observability Tools You Can Self-Host in 2026, AgentOps: observability, evals, and monitoring, agent evals and testing, AI gateways, AI agent frameworks compared, 8 Best LangSmith Alternatives in 2026, Including Open Source, and agent security.
Comparing Phoenix, Langfuse, and Helicone for self-host? Read Arize Phoenix vs Langfuse vs Helicone.